Summary of Tilt Analysis for
Sonic Anemometer Data
Last
updated: 23rd January, 2007. Phil Anderson
Contents (hyper-linked)
Method: describes method of generating and using the de-tilt matrix
Programmes: the Matlab programmes used in the analysis.
Results for 2003
Results for 2004
Results for 2007
We assume that the sonic anemometers used for turbulence studies since 2003 suffer from tilt, flow distortion and instrument offset. Measured vertical wind speed will therefore have mean values according to:
![]() (1)
(1)
where Cinst is the instrument offset, Cs is the flow distortion and is assume to be z-axially symmetric, Cu and Cv are the components of the tilt, s the wind speed, and [u,v] the wind velocity components.
In order to correct for these offsets, the function (1) was fitted to daily files of u,v and w from each sonic, to give a matrix, C[1x4]. That is, given known series of [ui, vi, wi] (and hence si), C is defined by:
![]() (2)
(2)
where
 (3)
(3)
C is then solved by least squares. For these studies, Matlab was used, and C was given directly once W and U were known using
![]() (4)
(4)
Processing reduction
The instruments were re-positioned each year, but during the winter, the same C should be valid. However, with a year of one minute average data the size W and U was unmanageable. In addition, quality control of the averages were needed, to ensure large spurious w values due to waves were eliminated as well as genuine poor quality data due to blowing snow or icing.
In order to reduce processing time of Eqn. 2, daily records of w are accumulated into u,v bins of width 0.2 ms-1 spanning the range -20 ms-1 to 20 ms-1 (200 x 200 bins). depending on the wind vectors that day, some bins would be empty or nearly so. Bins with < 50 records were rejected. The resulting scatter of mean w per bin against u,v was fitted to give a set of C for that day .
The resulting surfaces define by C for a whole month were then compared to each other by eye. Occasional spurious days were observed, where the surface appeared to differ significantly from the norm, and these were rejected. The mean monthly value of C were noted. The monthly values were then again compared, and those with large deviations from the norm rejected. I assume deviation is due to wave activity generating large w variance in the data. The best months then gave the mean and variance of the C coefficients used to correct w in the data.
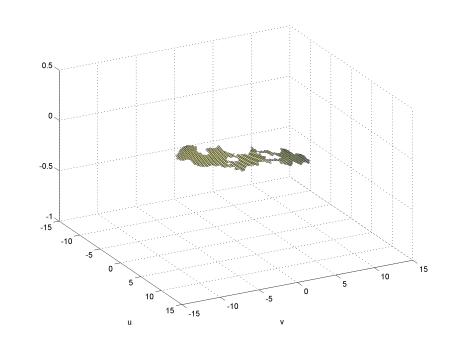
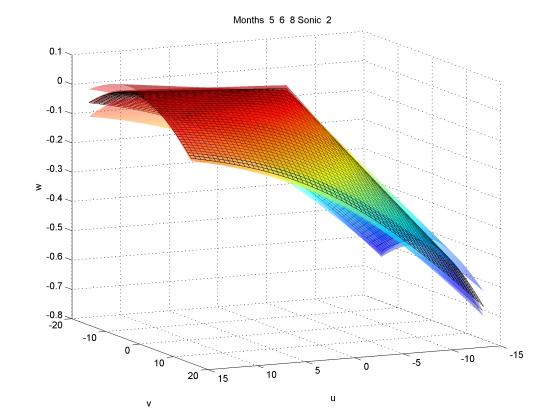
Example of daily surface of C showing sporadic coverage in [u, v].
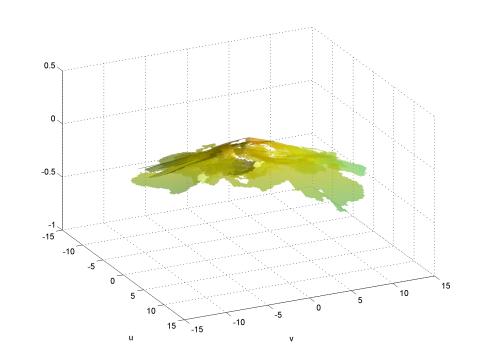
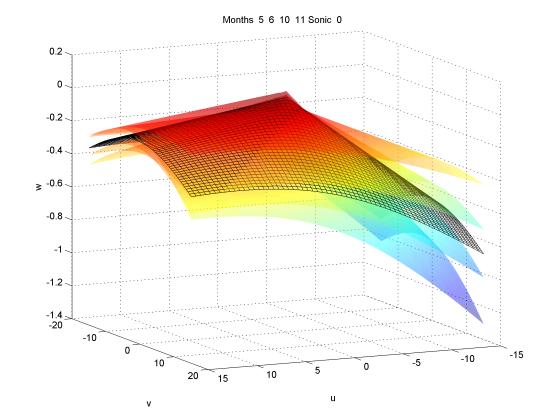
Example of a number of days accumulation of daily surfaces to build a complete coverage over [u, v]. (plots generated by look_at_tilt.m).
Discussion on methods of levelling.
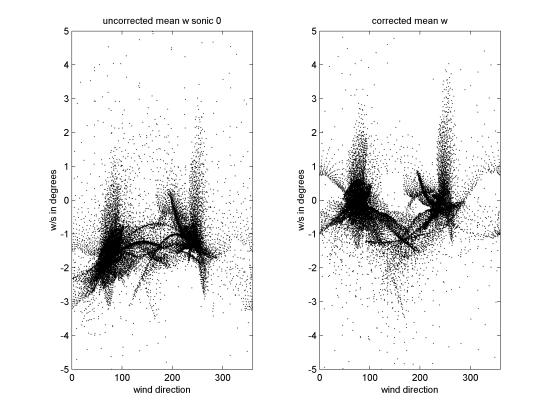
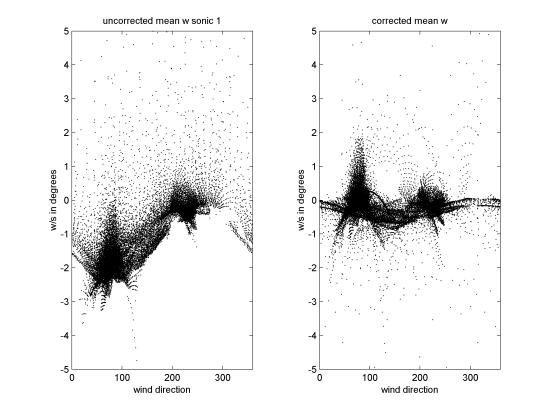
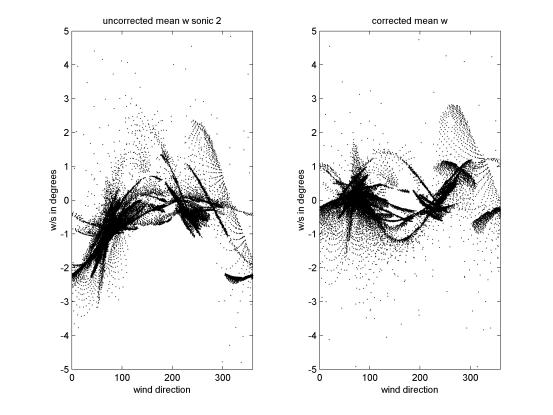
Given the surface, C, there still remains uncertainty as to how these coefficients should be used to level the data. Should C be used to correct for w only, or should the coefficients also define an instrument tilt, which is then removed from the data by rotation?
For instance, take the case that Cinst, Cu and Cv are zero, then the only distortion is by the apparent or real flow distortion, Cs. For an ideal instrument, the mean w observed for a given u and v would be sCs, generating a false u*, despite there being no actual instrument tilt.
Via unix SPACE project programme files appear as under
[previously users/icd/psan/space/]
users/psd/boundary/space
From P. S. Anderson's SAMBA drive, the relevant directories are under
U:\space\
In the following, file directory and file names will be given as
//space/...
that is, "//" implies "users/icd/psan/"
The tilt analysis programmes are held in
//SPACE/sonics_processing/m_files/tilt_find_original/
tilt_of_data4.m
input files are binary, type csYYMMDD.b0N, (see sonic_process.doc)
output files are csYYMMDD.t0N.
(see sonic_process.doc)
Format of csYYMMDD.t0N: a .mat file (use load <filename>) with UH, VH and WH. These are 2D arrays: UH and VH are the u and v bin lables, WH is the surface that best fits the w bins, using the surface function of equation (1).
bin_w_coefs is also recorded, where these are the coefficients for equation (1).
look_at_tilt.m
For a given month and a given sonic, look_at_tilt.m manually steps through the output from tilt_of_data4.m, (csYYMMDD.t0N) showing the results with surf and asks whether the surface should be accepted. If a "QC" file exists, it is loaded into the programme, otherwise a new file is generated. File name format is:
csYYMM.qcN
this file holds a char array, acc_rej[], of length = number of days in month, full of 'y' or 'n'. 'y' means accept the day for tilt processing, '0' means no (raw) data available. The programme steps through the days, modifies acc_rej[], and then saves it. Options on viewing and saving are held within the programme. The results for the 30 m mast sonics for each month are given below.
A qc file with only good days for all available sonics on a particular day is held in
csYYMM.qcn. This file (e.g. cs0711.qcn) is a -mat file holding the variable acc_rej (accept-reject). Load the qcn file, e.g.
load('cs0711.qcn')
and read the character array acc_rej to identify which days in the month have all available sonics generating good tilt fitting.
look_at_qc_tilt.m
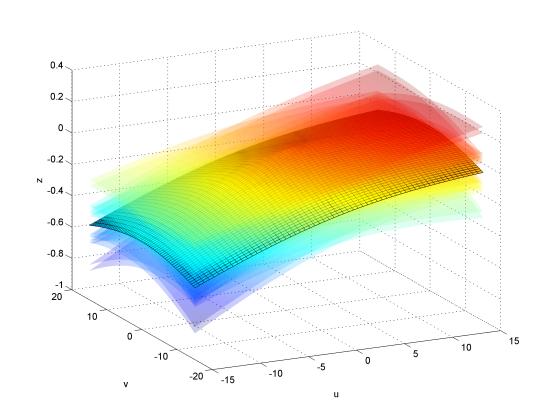
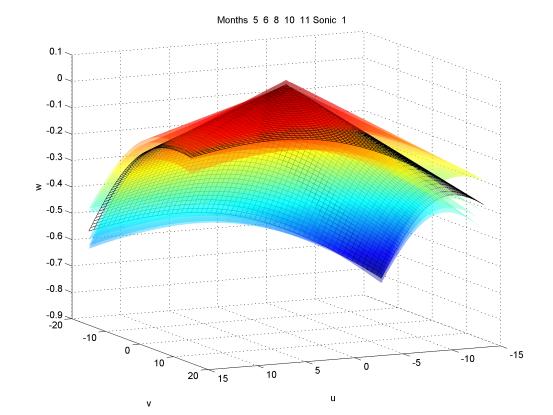
As per look_at_tilt.m, but shows the result of filtering with the csYYMM.qcN file. Must run over a number of months (two or more), as it finds the range of values in the coefs to generate errors in the coefs. Shows the individual months as clear, semi-transparent surfaces, with the mean surface as grid. Gives the coefs as mean and standard deviation.
qc_graphic_2.m
Loads in the csYYMM.qcN files and generates a graphical display of the files. Also, generates the csYYMM.qcn files which hold acc_rej, the variable that indicates when all sonics are good.
tilt_error.m
Looks at the results from the overall mean and error and plots the various extreme cases, that is, plots 16 surfaces, for each + and - of the four known parameters.
Data availability
Days of each month where surface fitting for that day appears to be well behaved.
'0' indicates data not available for that day.
'y' = good fitting
'n' = poor fitting, ignore that day.
Sonic 012 is 'y' when all three 0, 1 and 2 are also 'y'.
|
Month |
Sonic |
Days
of well behaved surface fitting |
|
May |
0 |
yynyyyyyyyynynyyyyyyyyyyynynnyy |
|
1 |
yynnyyyyyyynynyyyyyyyyyyyyyyynn |
|
|
2 |
yyynnnyyyyyyynyyyyyyyyyyyyyyyyn |
|
|
012 |
yynnnnyyyyynynyyyyyyyyyyynynnnn |
|
|
3 |
yynnnyyyyyyyy000000000000000000 |
|
|
4 |
yynnyyyyyyynn00yyyynyyyyyyyynnn |
|
|
June |
0 |
nnyyyyyynyynnnyyyynyyyyyyyyyyy |
|
1 |
nyyyyyyynyyynyyyyyynnyyyyynyyy |
|
|
2 |
yyyyyynnnnnyyyyyyy000yynnyyyyy |
|
|
012 |
nnyyyynnnnnnnnyyyynnnyynnynyyy |
|
|
3 |
nyyyyyyyyyynyyyyyyyynyynnyyyyy |
|
|
4 |
nyyyyyyyyyyyyyyyyyyyyyyynnyyyy |
|
|
July |
0 |
yyny0nnyyyyynyy0nyyyyyynnnynyyy |
|
1 |
ynnyyyyyyynnnyy0nyyyyyyyyyyyyyy |
|
|
2 |
n0nyyyyyyynnnyy0nyyyyynnnnyyynn |
|
|
012 |
nnnynnnyyynnnyynnyyyyynnnnynnnn |
|
|
3 |
nynyyyyyyynynyn0nyyyyyyyyynyyyn |
|
|
4 |
nnnyyyyyyynynyn0nyyynnyyyyyyyyy |
|
|
August |
0 |
nyyyyyyyyyyyyyyyynyny0yyyyyyyyn |
|
1 |
nyyyyyyyyyyyyyyyyyyyy0yyyyyyyyy |
|
|
2 |
nnyyyyyyyyyyyyyyyyynn0yynnyyyyy |
|
|
012 |
nnyyyyyyyyyyyyyyynynnnyynnyyyyn |
|
|
3 |
yyyyyyyyyyyynyyyynyyy0ynyyyyyyn |
|
|
4 |
nnnyyyyyyyyyyyyyynyy00yyyyyyyyy |
|
|
September |
not
available |
|
|
October |
0 |
000yyyynyyyyynyynyyyyyynyynnyyy |
|
1 |
000yyyynyyyyynynnyyyyyynyynyyyy |
|
|
2 |
000yyyyyyyyyyynnnyyyyyyyyynyyyy |
|
|
012 |
nnnyyyynyyyyynnnnyyyyyynyynnyyy |
|
|
3 |
000yyyyyyyyyyyyyyyyyyyyyyyyyyyy |
|
|
4 |
000yyyyyyyyyyy0nnnyyyyyyyynyyyy |
|
|
November |
0 |
yyyyyyyyyyyyyyyyyyyyyyyyyyyyyy |
|
1 |
yyyyyyyyyyyyyyyynyyyynnyyyyyyy |
|
|
2 |
yyyyyyynyyyyyyyynyyyynnynnyyyy |
|
|
012 |
yyyyyyynyyyyyyyynyyyynnynnyyyy |
|
|
3 |
yyyyyyyyyyyyyyyyyyyyyyyyyyyyyy |
|
|
4 |
yyyyyyyyyyyyyyyyyyyyyyyyyyyyyy |
|
|
December |
not
analysed |
|
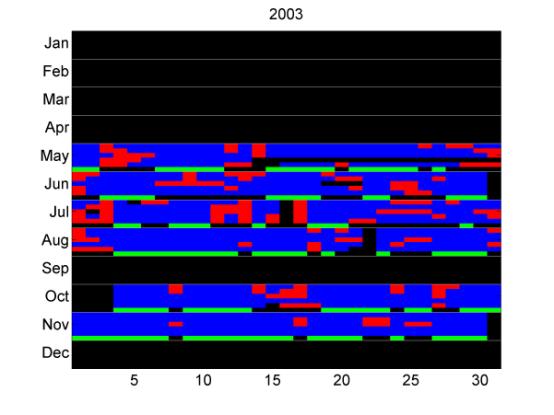
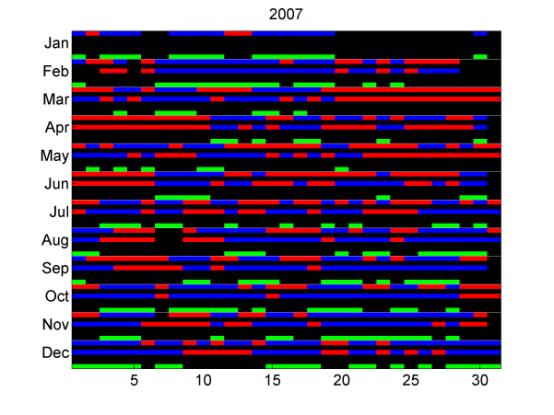
Same data as in the table above, showing monthly coverage of tilt analysis for each sonic. Blue indicates well fitted surface to the tilt analysis for the individual sonic anemometer, red indicates a poor fit. Green indicates when all available sonic data for that day are giving good surface fitting.
Surface analysis
The final tilt correction for a particular sonic may be taken from the mean correction generated by set of daily files. To check on sensitivity, whole months were taken to generate an average surface, and the various surfaces compared. Two versions of the complete month were tested, specific and overall. Specific sets used the best days for that specific sonic, that is, "sonic 0" days in the table above. Overall sets used only those days that were suitable for all three sonics; "sonic 012" above.
In general, using specific set generated smaller errors due to the larger data volume used in the analysis. For example:
Months 5 and 6, 2003 were found to be well behaved months for all three levels.
For specific day sets, the final tilt analysis gave the following
|
Sonic |
months in set |
Cinst |
Cs |
Cu |
Cv |
|
0
|
5,6 |
0.0120±0.0382 |
-0.0254±0.0132 |
0.0143±0.0047 |
-0.0002±0.0057 |
|
1
|
5,6 |
0.0460±0.0151
|
-0.0234±0.0006 |
0.0065±0.0006 |
0.0168±0.0002 |
|
2
|
5,6 |
0.0356±0.0107 |
-0.0192±0.0011 |
0.0194±0.0013 |
-0.0011±0.0018 |
For month 5, 6, 7, 8 , 10 and 11, 2003 specific individual files generate the following
|
Sonic |
months in set |
Cinst |
Cs |
Cu |
Cv |
|
0
|
5,
6, 7, 8, 10, 11 |
0.0325±0.0304 |
-0.0312±0.0096 |
0.0175±0.0085 |
-0.0028±0.0046 |
|
1
|
5,
6, 7, 8, 10, 11 |
0.0408±0.0092
|
-0.0233±0.0016 |
0.0092±0.0025 |
0.0145±0.0025 |
|
2
|
5,
6, 7, 8, 10, 11 |
0.0376±0.0343
|
-0.0181±0.0017 |
0.0186±0.0041 |
-0.0024±0.0022 |
Months 5, 6, 7, 8 , 10 and 11, 2003 overall monthly qc files generate the following
|
Sonic |
months in set |
Cinst |
Cs |
Cu |
Cv |
|
0
|
5,
6, 7, 8, 10, 11 |
0.0355±0.0513 |
-0.0314±0.0135 |
0.0160±0.0063 |
-0.0034±0.0063 |
|
1
|
5,
6, 7, 8, 10, 11 |
0.0468±0.174
|
-0.0239±0.0008 |
0.0076±0.0032 |
0.0149±0.0024 |
|
2
|
5,
6, 7, 8, 10, 11 |
0.0260±0.0189
|
-0.0149±0.0046 |
0.0162±0.0056 |
0.0006±0.0060 |
Using individual q.c. files produce smaller errors as there is better wind rose coverage for that individual sonic. Outlying months were visible in the overlay plots of the surfaces. The resulting months chosen were:
Sonic 0 5 6 10 11
Sonic 1 5 6 8 10 11
Sonic 2 5 6 8
Sonic 3 5 6 7 8 10 11
Sonic 4 5 6 7 8 11
Final Tilt corrections for 2003 sonics:
|
Sonic |
months in set |
Cinst |
Cs |
Cu |
Cv |
|
0
|
5,
6, 10, 11 |
0.0251±0.0328 |
-0.0297±0.0103 |
0.0164±0.0071 |
-0.0021±0.0057 |
|
1
|
5,
6, 8, 10, 11 |
0.0395±0.098
|
-0.0238±0.0008 |
0.0089±0.0027 |
0.0141±0.0026 |
|
2
|
5,
6, 8, |
0.0318±0.0100
|
-0.0187±0.0012 |
0.0196±0.0010 |
-0.0020±0.0020 |
|
3
|
5,
6, 7, 8, 10, 11 |
0.0715±0.0353
|
-0.0344±0.0068 |
0.0177±0.0046 |
-0.0038±0.0057 |
|
4
|
5,
6, 7, 8 11 |
0.0373±0.0175
|
-0.0257±0.0035 |
0.0071±0.0027 |
-0.0081±0.0014 |
Details: Sonic 0: 4m level on 30 m mast. Monthly surfaces used get best fit: 5, 6, 10, 11
Details: Sonic 1: 16m level on 30 m mast. Monthly surfaces used get best fit: 5, 6, 8, 10, 11
Details: Sonic 2: 30m level on 30 m mast. Monthly surfaces used get best fit: 5, 6, 8,
Data availability
|
Month |
Sonic |
|
|
February |
0 |
nnnnyyyyyyyyyyyyyyyyyyyyyyyyy |
|
1 |
nnnnyyyyyyyyyyyyyyyyyyyyyyyyy |
|
|
2 |
nnnnyyyyyyyyyyyyyyyyyyyyyyyyy |
|
|
012 |
nnnnyyyyyyyyyyyyyyyyyyyyyyyyy |
|
|
March |
0 |
yyyyyyyyyyyyyyyyyyyyyyyyyynnyyy |
|
1 |
yyyyyyyyyyyyyyyyyyyyyyynnynnnyy |
|
|
2 |
nyyyyyyyyyyyyynyyyyyyyynnnnnnyy |
|
|
012 |
nyyyyyyyyyyyyynyyyyyyyynnnnnnyy |
|
|
April |
0 |
yyyyynyynyyyyynnnyyyynyyy00000 |
|
1 |
yyyyyyyyyyyyyyyyyyynynyyy00000 |
|
|
2 |
yyyynyyynyyyyyynnynnnnnnn00000 |
|
|
012 |
yyyyynyynyyyyynnnynnnnnnn00000 |
|
|
May June |
not available |
|
|
July |
0 |
nnynnyyyynynnnyyyyyyyyyyyyynyyn |
|
1 |
nnynnnyynnyyyyyyyyyyyyyyyyyyyyy |
|
|
2 |
0nnnnnyynyynynnynnyyynyyyynnnyy |
|
|
012 |
0nnnnnyynnynnnnynnyyynyyyynnnnn |
|
|
August |
0 |
yyynnnnyyyyynyyyynnynyyyyyynyyn |
|
1 |
yyynnynyyyyyyyyyynnyyyyyyyyyyyn |
|
|
2 |
yyyynynnyyyyyyyyynnynyyynyyyyyy |
|
|
012 |
yyynnnnnyyyynyyyynnynyyynyynyyn |
|
|
September |
0 |
nnyyyynyyyyyyyyyynn0nynyyyyyny |
|
1 |
nnyyyynnyyyyyyynyynnnyyynyyyyy |
|
|
2 |
nnyyyynnyyyyyynnnynnnyyynyyyny |
|
|
012 |
nnyyyynnyyyyyynnnnn0nynynyyyny |
|
|
October |
0 |
nn0nnyynyynyyyyynyyyyyyyyyynyyn |
|
1 |
nnnnyyyyyyyyyyyy0yyyyyyyyyyyyyy |
|
|
2 |
nnnnyyyyyyyyyyyynyyyyyyyyyyyyyy |
|
|
012 |
nn0nnyynyynyyyyy0yyyyyyyyyynyyn |
|
|
November |
0 |
yyyyyyyyyyyyyyyyyyyyyyyyynyyyy |
|
1 |
ynynyyyyyyyyyyyyyyyyyyyyyyynny |
|
|
2 |
ynyyyyyyyyynyyyyyyyyyyyyyyynyy |
|
|
012 |
ynynyyyyyyynyyyyyyyyyyyyyyynny |
|
|
December |
not analysed |
|
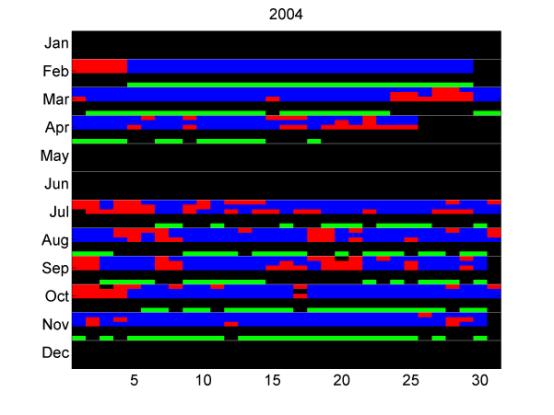
Same data as table immediately above.
Months chosen for final tilt analysis for 2004
Sonic 0 2 3 4
Sonic 1 2 3 4
Sonic 2 2 3 4
Final Tilt corrections for 2004 sonics:
|
Sonic |
months
in set |
Cinst |
Cs |
Cu |
Cv |
|
0
|
2
3 4 |
0.0009±0.0066 |
-0.0246±0.0016 |
0.0094±0.0060 |
-0.0013±0.0018 |
|
1 |
2 3 4 |
0.0350±0.0069 |
-0.0230±0.0019 |
0.0017±0.0012 |
0.0121±0.0008 |
|
2 |
2 3 4, |
0.0229±0.0074 |
-0.0180±0.0014 |
0.0034±0.0022 |
-0.0043±0.0012 |
Data availability and quality of surface fitting to w/s(u,v)
Only sonic 0 and 2 were operating during 2007.
Sonic 0 6 7 8 9 10 11 12
Sonic 2 2 3 4 5 6 7 8 9 10 11 12
Final Tilt corrections for 2007 sonics:
|
Sonic |
months
in set |
Cinst |
Cs |
Cu |
Cv |
|
0
|
6:12 |
0.0490±0.0260 |
-0.0330±0.0048 |
-0.0007±0.0089 |
-0.0067±0.0070 |
|
2 |
2:12 |
0.0558±0.0302 |
-0.0171±0.0036 |
0.0259±0.0053 |
-0.0002±0.0036 |